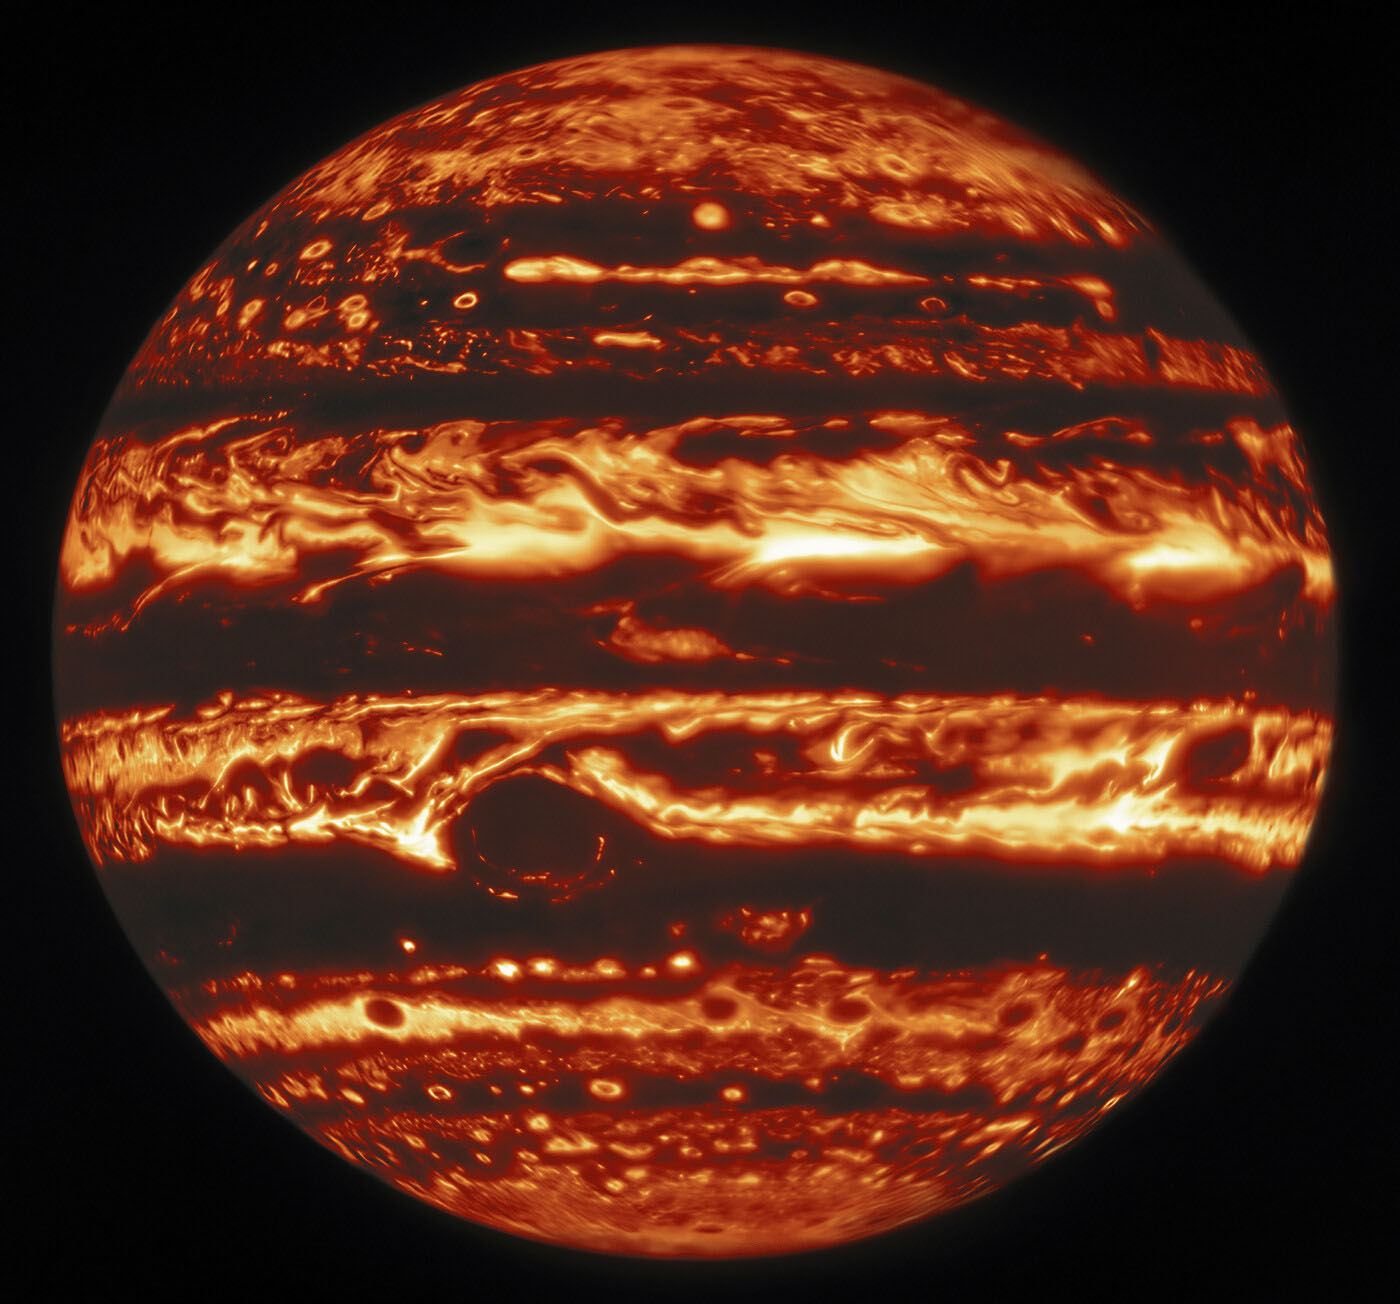
NOIRLab: Gemini North Infrared View of Jupiter

This infrared view of Jupiter was created from data captured on 11 January 2017 with the Near-InfraRed Imager (NIRI) instrument at Gemini North in Hawaiʻi, the northern member of the international Gemini Observatory, a Program of NSF’s NOIRLab. Credit: International Gemini Observatory/NOIRLab/NSF/AURA, M.H. Wong (UC Berkeley) et al. Acknowledgments: M. Zamani
Stunning new images of Jupiter from Gemini North and the NASA/ESA Hubble Space Telescope showcase the planet at infrared, visible, and ultraviolet wavelengths of light. These views reveal details in atmospheric features such as the Great Red Spot, superstorms, and gargantuan cyclones stretching across the planet’s disk. Three interactive images allow you to compare observations of Jupiter at these different wavelengths and explore the gas giant’s clouds yourself!
Three striking new images of Jupiter show the stately gas giant at three different types of light — infrared, visible, and ultraviolet. The visible and ultraviolet views were captured by the Wide Field Camera 3 on the Hubble Space Telescope, while the infrared image comes from the Near-InfraRed Imager (NIRI) instrument at Gemini North in Hawaiʻi, the northern member of the international Gemini Observatory, a Program of NSF’s NOIRLab. All of the observations were taken simultaneously (at 15:41 Universal Time) on 11 January 2017.
These three portraits highlight the key advantage of multiwavelength astronomy: viewing planets and other astronomical objects at different wavelengths of light allows scientists to glean otherwise unavailable insights. In the case of Jupiter, the planet has a vastly different appearance in the infrared, visible, and ultraviolet observations. The planet’s Great Red Spot — the famous persistent storm system large enough to swallow the Earth whole — is a prominent feature of the visible and ultraviolet images, but it is almost invisible at infrared wavelengths. Jupiter’s counter-rotating bands of clouds, on the contrary, are clearly visible in all three views.
Observing the Great Red Spot at multiple wavelengths yields other surprises — the dark region in the infrared image is larger than the corresponding red oval in the visible image. This discrepancy arises because different structures are revealed by different wavelengths; the infrared observations show areas covered with thick clouds, while the visible and ultraviolet observations show the locations of chromophores — the particles that give the Great Red Spot its distinctive hue by absorbing blue and ultraviolet light.
The Great Red Spot isn’t the only storm system visible in these images. The region sometimes nicknamed Red Spot Jr. (known to Jovian scientists as Oval BA) appears in both the visible and ultraviolet observations [1]. This storm — to the bottom right of its larger counterpart — formed from the merger of three similar-sized storms in 2000 [2]. In the visible-wavelength image, it has a clearly defined red outer rim with a white center. In the infrared, however, Red Spot Jr. is invisible, lost in the larger band of cooler clouds, which appear dark in the infrared view. Like the Great Red Spot, Red Spot Jr. is colored by chromophores that absorb solar radiation at both ultraviolet and blue wavelengths, giving it a red color in visible observations and a dark appearance at ultraviolet wavelengths. Just above Red Spot Jr. in the visible observations, a Jovian superstorm appears as a diagonal white streak extending toward the right side of Jupiter’s disk.
One atmospheric phenomenon that does feature prominently at infrared wavelengths is a bright streak in the northern hemisphere of Jupiter. This feature — a cyclonic vortex or perhaps a series of vortices — extends 72,000 kilometers (nearly 45,000 miles) in the east-west direction. At visible wavelengths the cyclone appears dark brown, leading to these types of features being called ‘brown barges’ in images from NASA’s Voyager spacecraft. At ultraviolet wavelengths, however, the feature is barely visible underneath a layer of stratospheric haze, which becomes increasingly dark toward the north pole.
Similarly, lined up below the brown barge, four large ‘hot spots’ appear bright in the infrared image but dark in both the visible and ultraviolet views. Astronomers discovered such features when they observed Jupiter in infrared wavelengths for the first time in the 1960s.
As well as providing a beautiful scenic tour of Jupiter, these observations provide insights about the planet’s atmosphere, with each wavelength probing different layers of cloud and haze particles. A team of astronomers used the telescope data to analyze the cloud structure within areas of Jupiter where NASA’s Juno spacecraft detected radio signals coming from lightning activity.
The scientific story behind these striking images is told in full in a new NOIRLab Stories blog post. As well as discovering the science behind these images, we invite you to inspect observations of Jupiter at home! Three interactive images let you compare observations of Jupiter at different wavelengths and peer beneath the gas giant’s clouds:
- Interactive image comparison of Gemini infrared data and Hubble visible data
- Interactive image comparison of Hubble visible data with Hubble ultraviolet data
- Interactive image comparison of Gemini infrared data with Hubble ultraviolet data
“The Gemini North observations were made possible by the telescope’s location within the Maunakea Science Reserve, adjacent to the summit of Maunakea,” acknowledges the observation team’s leader, Mike Wong of the University of California, Berkeley. “We are grateful for the privilege of observing Ka‘āwela (Jupiter) from a place that is unique in both its astronomical quality and its cultural significance.”
More information on the infrared observations from Gemini is provided in the NOIRLab press release Gemini Gets Lucky and Takes a Deep Dive Into Jupiter’s Clouds.
